Displaying Charts
Quick Start Video
Watch a quick video to learn about the Chart feature in Calibration Control (our Calibration Management Software).
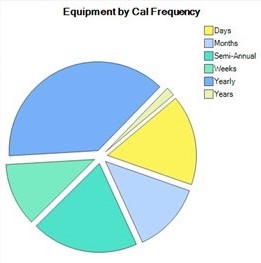
Use Pie, Column, and Bar Charts to Visualize Your Data
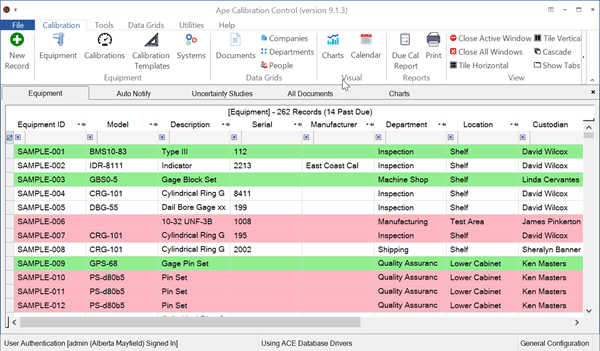
Display the Charts grid by clicking on the Charts icon in the Calibration tab of the ribbon menu.
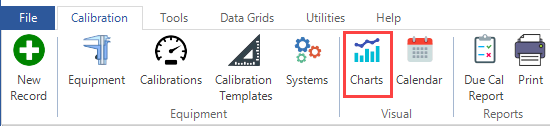
Chart Data Tables
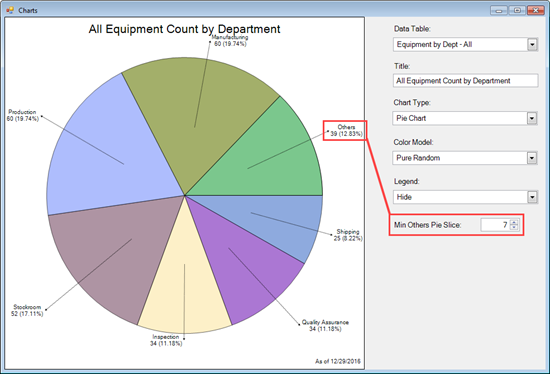
Use the Data Table combo box to select what information is shown in the Chart.
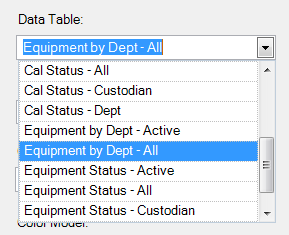
Customize a Chart by editing the default Title and by changing the settings for Chart Type, Color Model, and Legend position. Use the Data Table combo box to choose which department information is used.
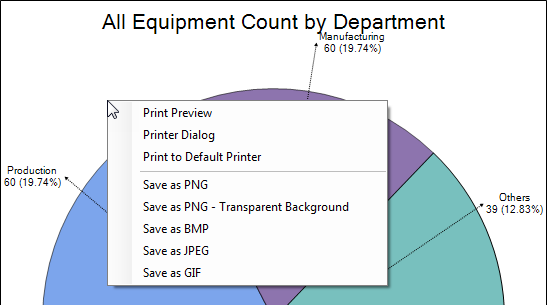
Saving and Printing Charts
Right-click the Chart screen to Save (several formats) or Print the Chart. ‘Save as PNG – Transparent Background’ is recommended for use in reports and presentations with backgrounds other than white.
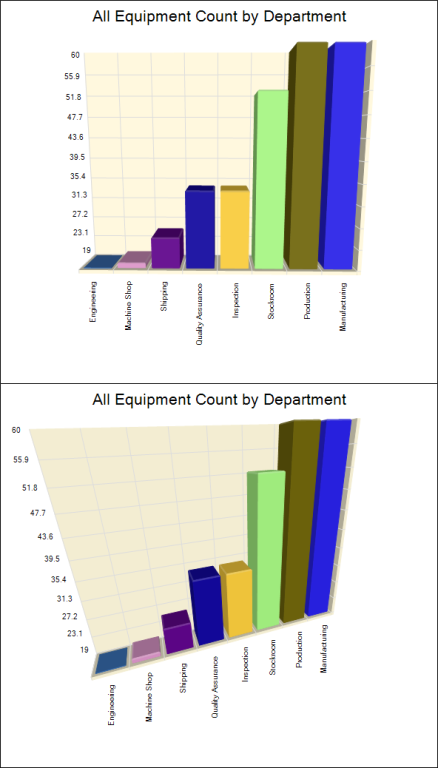
3D Charts
Change the viewing angle on 3D Chart Types by holding down [Alt] and then clicking and dragging the mouse to the best angle. Zoom in and out of the Chart by rolling the mouse roller back and forth while keeping the [Alt] button pressed.
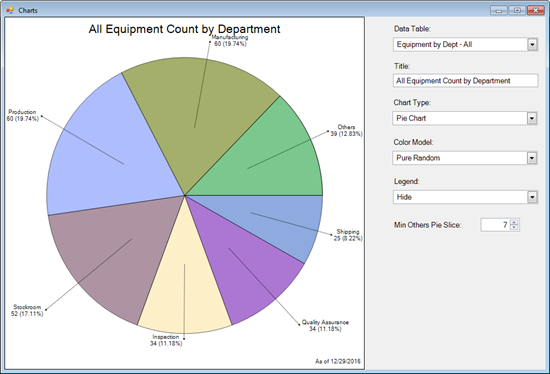
‘Min Others Pie Slice’ (for pie charts only)
Use ‘Min Others Pie Slice’ to group very small percentages into an ‘Other’ category. This helps to declutter the pie chart when there are too many slices.